如何使用TigerGraph Insights创建一个可视化图分析应用程序
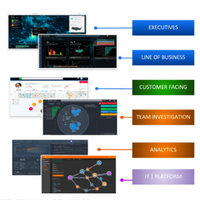
为了简化构建可视化图分析应用程序,TigerGraph Insights 支持用户在可视化界面上简单地点击、拖放,即可构建具有丰富交互功能的、多页面的、数据驱动的可视化图表,并支持传统的BI视图部件。这些图还可以借助交互式dashboard连接起来,以便轻松共享,从而更深入地了解和洞察关联数据。
为了简化构建可视化图分析应用程序,TigerGraph Insights 支持用户在可视化界面上简单地点击、拖放,即可构建具有丰富交互功能的、多页面的、数据驱动的可视化图表,并支持传统的BI视图部件。这些图还可以借助交互式dashboard连接起来,以便轻松共享,从而更深入地了解和洞察关联数据。
TigerGraph Cloud 3.8版本简化了集群发放和管理体验。单击几下就可以创建一个新的集群,并在几分钟内开始使用一个图。通过现有GraphStudio的集成体验和全新工具的添加,TigerGraph Cloud实现了图数据库开发人员、管理员、数据分析师和数据科学家之间的无摩擦协作,以最大限度地发挥TigerGraph图数据库平台的全部潜力。
本文节选自白皮书《智能助力反欺诈——TigerGraph金融犯罪调查工具包》。TigerGraph的实时图技术和分析工具为银行和金融服务行业提供了一个难得的机会,可以彻底转变整个反洗钱领域。基于图构建自定义的可视化仪表盘,可以大幅提高分析的有效性和决策的精准性。
Leo Meyerovich, Founder, Graphistry, Inc.
Bethany Lyons, Senior Product Manager, Tableau Software; Victor Lee, Head of Product Strategy & Developer Relations

Anna Veronika Dorogus
Machine Learning Expert
Anna Veronika Dorogush graduated from Lomonosov Moscow State University and Yandex School of Data Analysis. She used to work at ABBYY, Yandex, Microsoft and Google on Machine Learning infrastructure and Machine Learning frameworks. In 2017 she published the open-source library CatBoost, which is now one of top-3 most popular Gradient Boosting libraries, and the top 7-th most used Machine Learning framework in the world according to Kaggle 2021 review.


